Benchmarks
Every script under benches/ is built on chuchichaestli.benchmark, so they
share a command line and a way of reporting, and one section here covers each
of them. The external libraries are not dependencies; pull them in for the run
with --with.
Common to all: a backend is checked against a reference before it is timed, so
a fast wrong answer cannot win; --threads pins the torch intra-op count and
--device chooses where to run; --repeats N measures in that many fresh
processes and reports the median with the spread across them; --json saves
the results and --from-json reports or plots saved ones without measuring
again.
Discrete wavelet transform
benches/dwt_impl.py times the native kernels against the pure-torch path,
and external libraries, always checking each against a reference before timing
it.
Measuring
Measure once and keep the json, one run per workload per device:
taskset -c 0-15 \
  uv run --with pywavelets --with ptwt --with pytorch_wavelets \
    python benches/dwt_impl.py \
      --device cpu \
      --threads 1 \
      --dims 1 2 3 \
      --sizes 4096 256x256 64x64x64 \
      --wavelets haar \
      --modes zero \
      --levels 3 \
      --repeats 5 \
      --json litevae-cpu.json
uv run --with ptwt --with pytorch_wavelets \
  python benches/dwt_impl.py \
    --device cuda \
    --backends c3li-torch c3li-kernel ptwt ptwavelets \
    --dims 1 2 3 \
    --sizes 4096 256x256 64x64x64 \
    --wavelets haar \
    --modes zero \
    --levels 3 \
    --repeats 5 \
    --json litevae-cuda.json
taskset -c 0-15 \
  uv run --with pywavelets --with ptwt --with pytorch_wavelets \
    python benches/dwt_impl.py \
      --device cpu \
      --threads 1 \
      --dims 1 2 3 \
      --sizes 16384 512x512 96x96x96 \
      --wavelets bior2.2 bior4.4 \
      --modes symmetric \
      --levels 3 \
      --repeats 5 \
      --json jpeg2000-cpu.json
uv run --with ptwt --with pytorch_wavelets \
  python benches/dwt_impl.py \
    --device cuda \
    --backends c3li-torch c3li-kernel ptwt ptwavelets \
    --dims 1 2 3 \
    --sizes 16384 512x512 96x96x96 \
    --wavelets bior2.2 bior4.4 \
    --modes symmetric \
    --levels 3 \
    --repeats 5 \
    --json jpeg2000-cuda.json
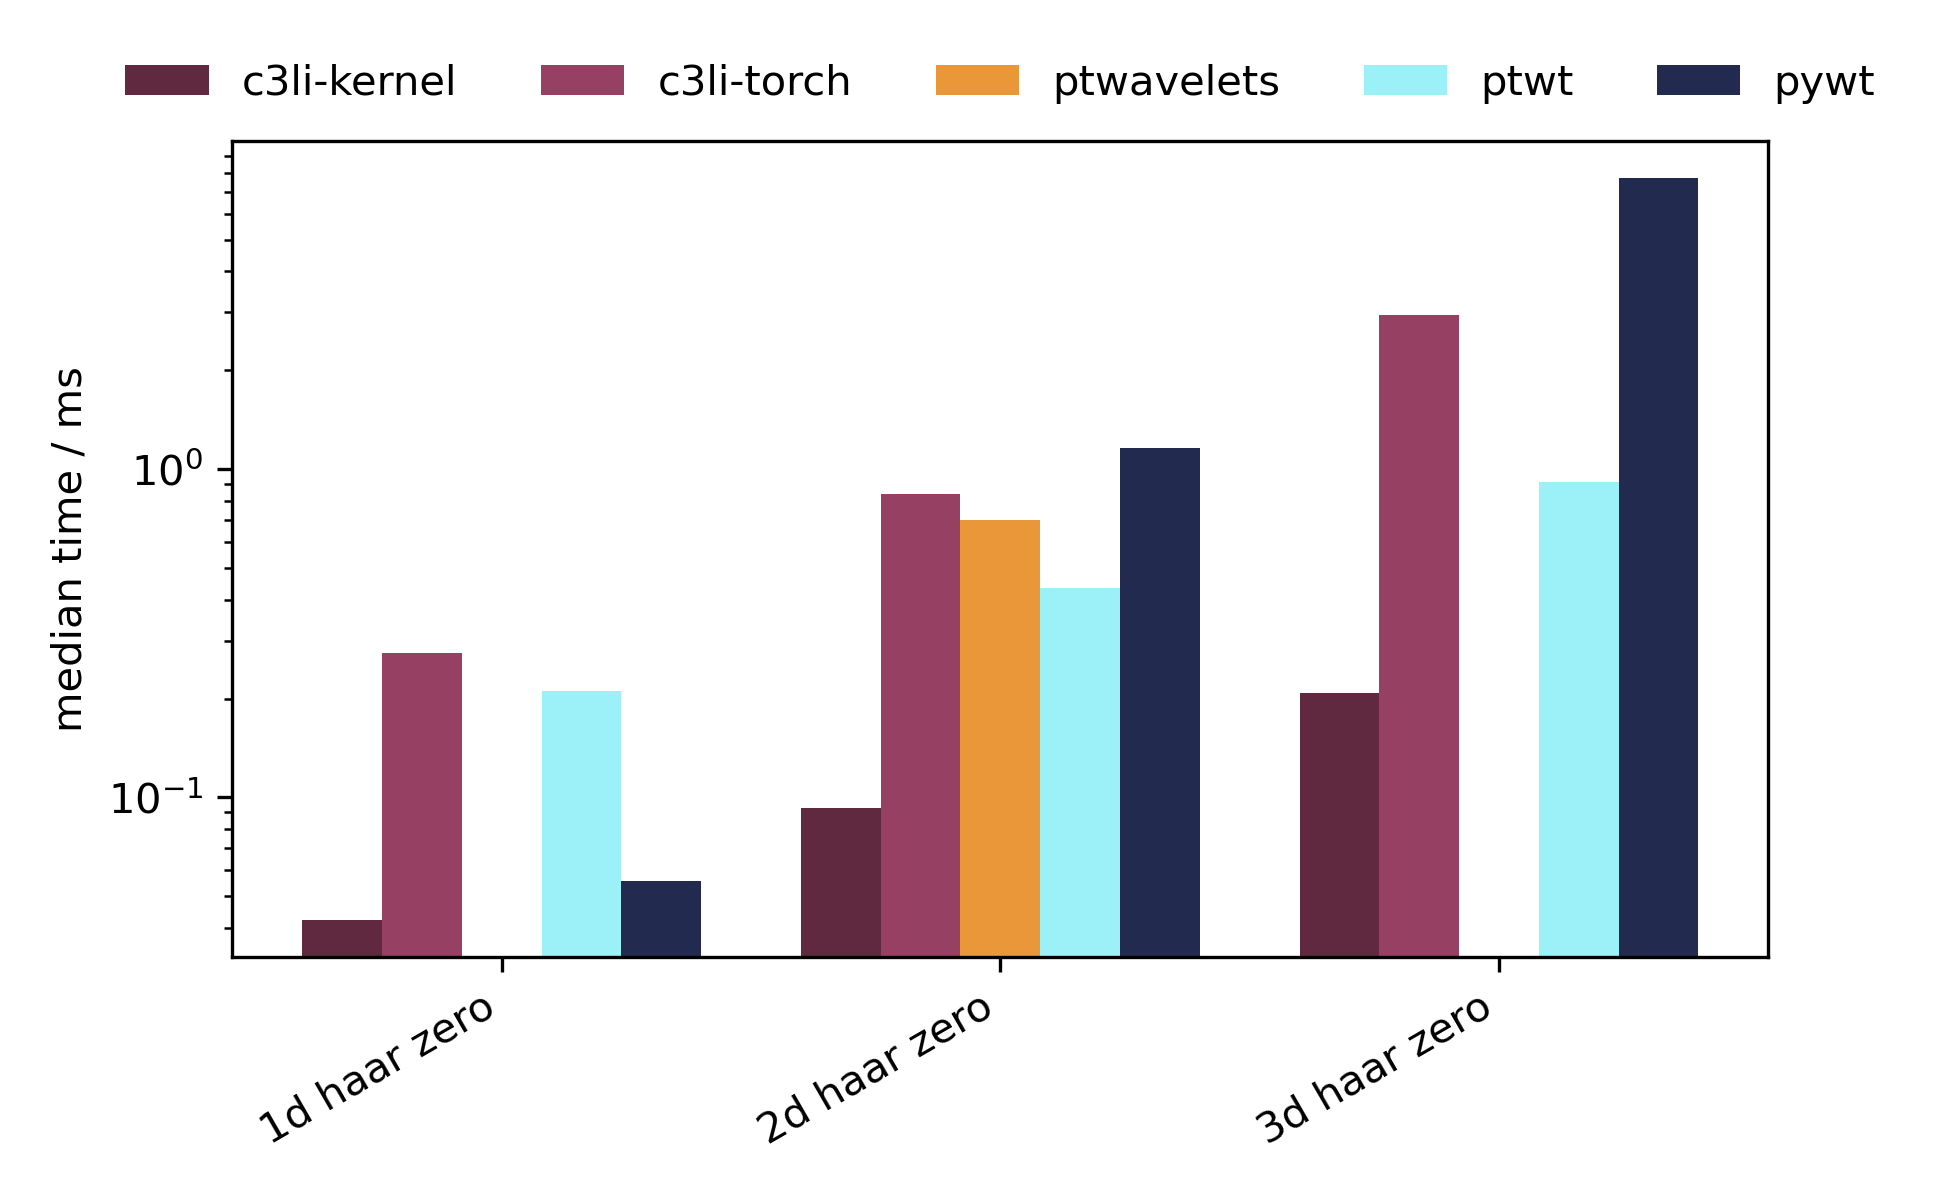
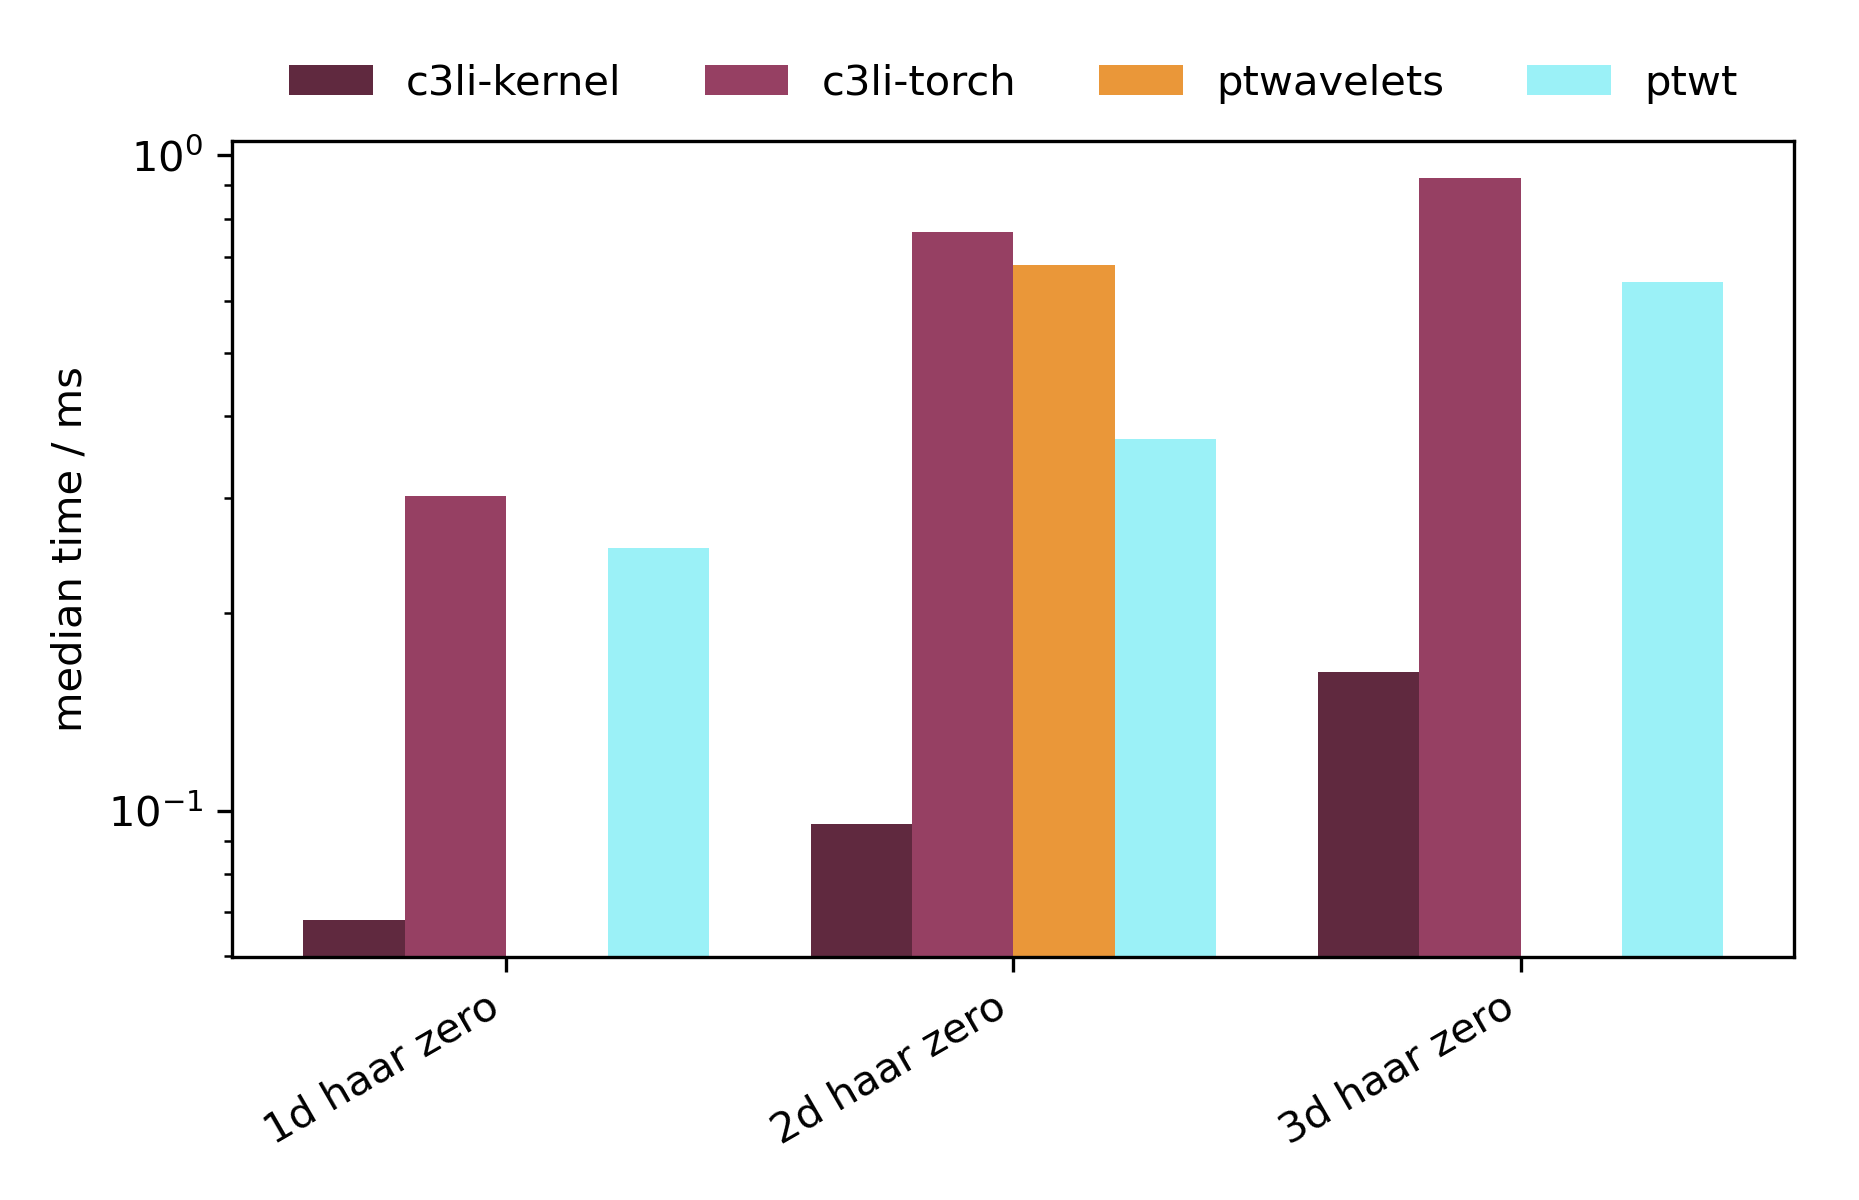
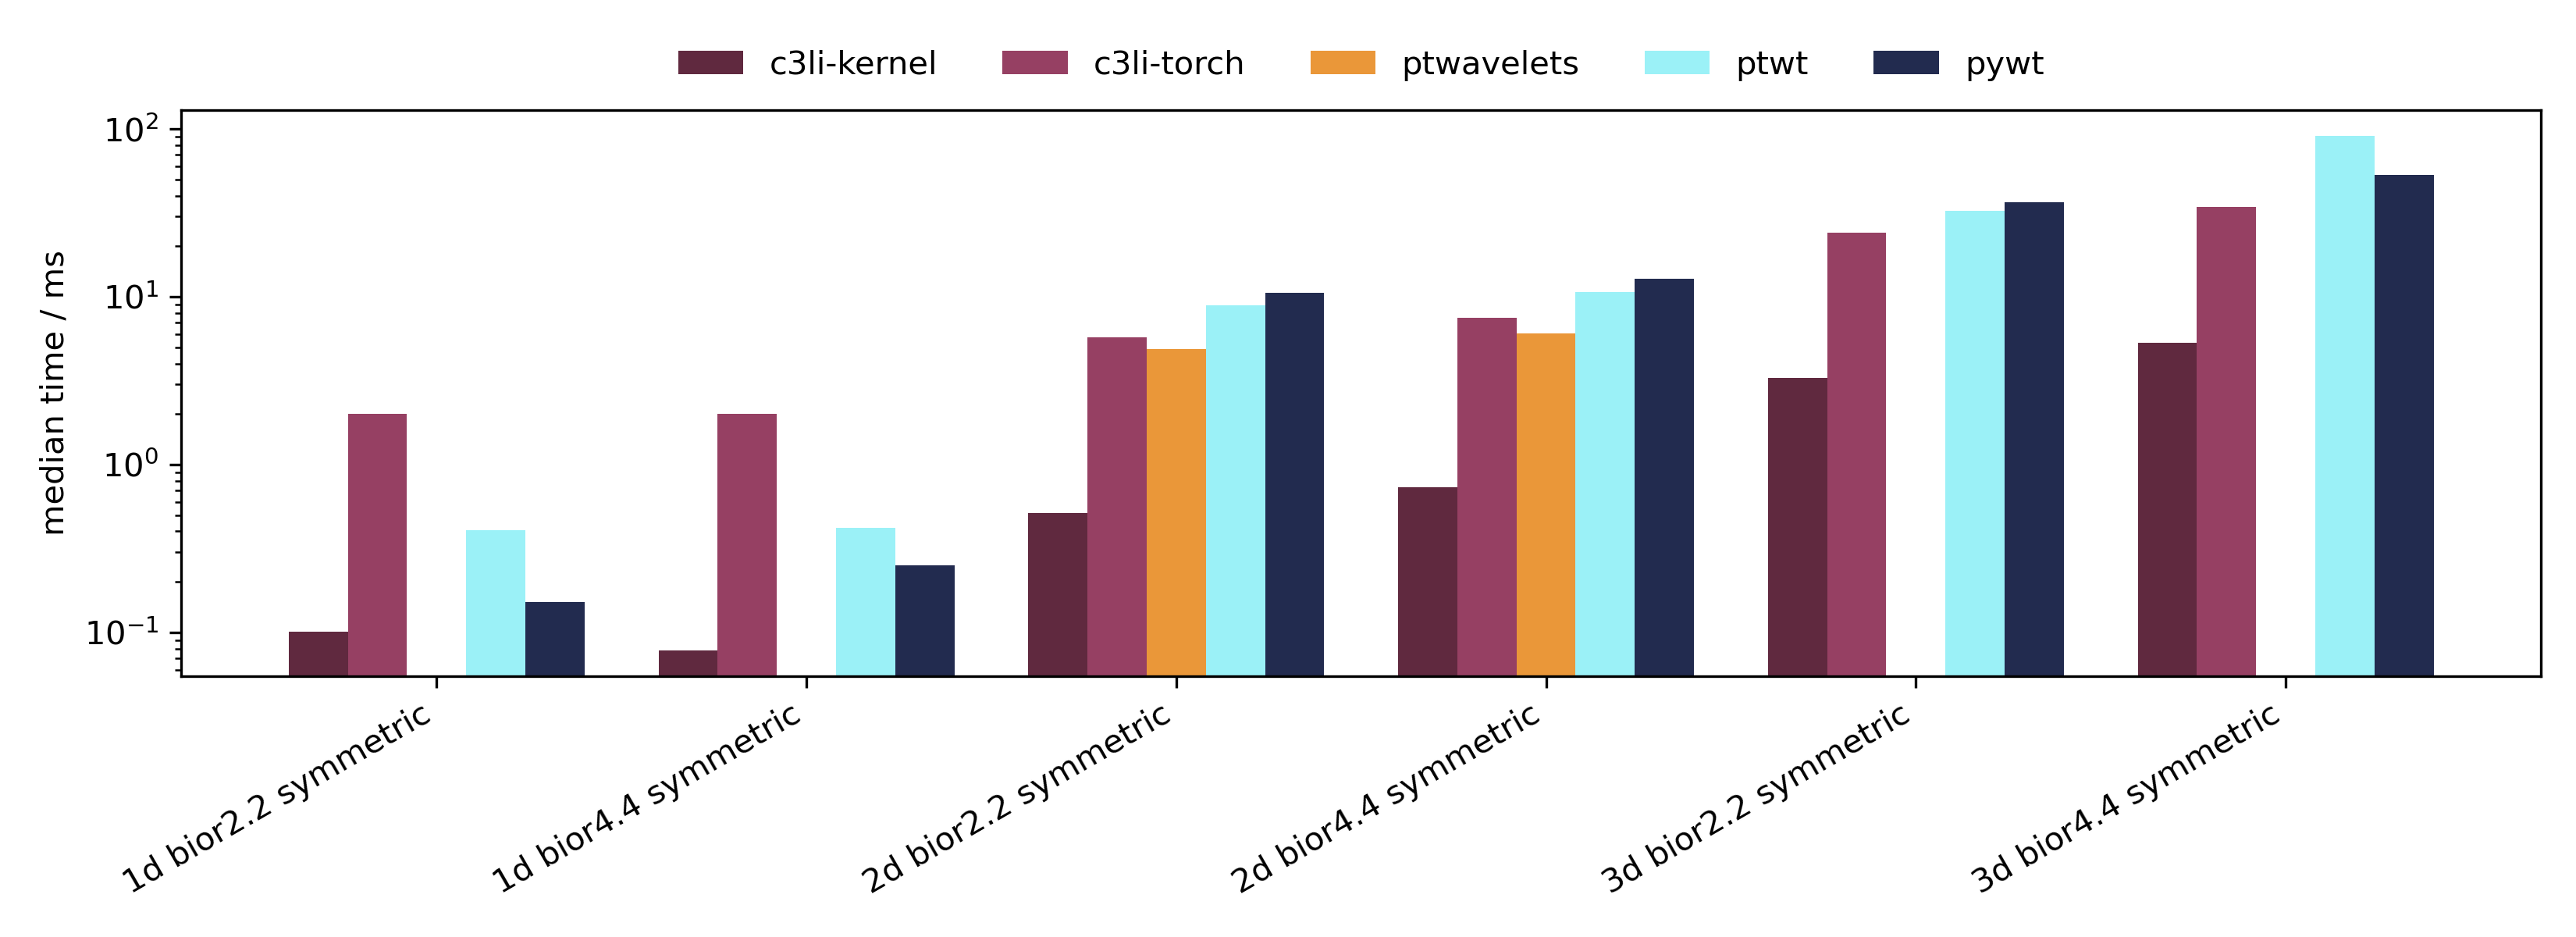
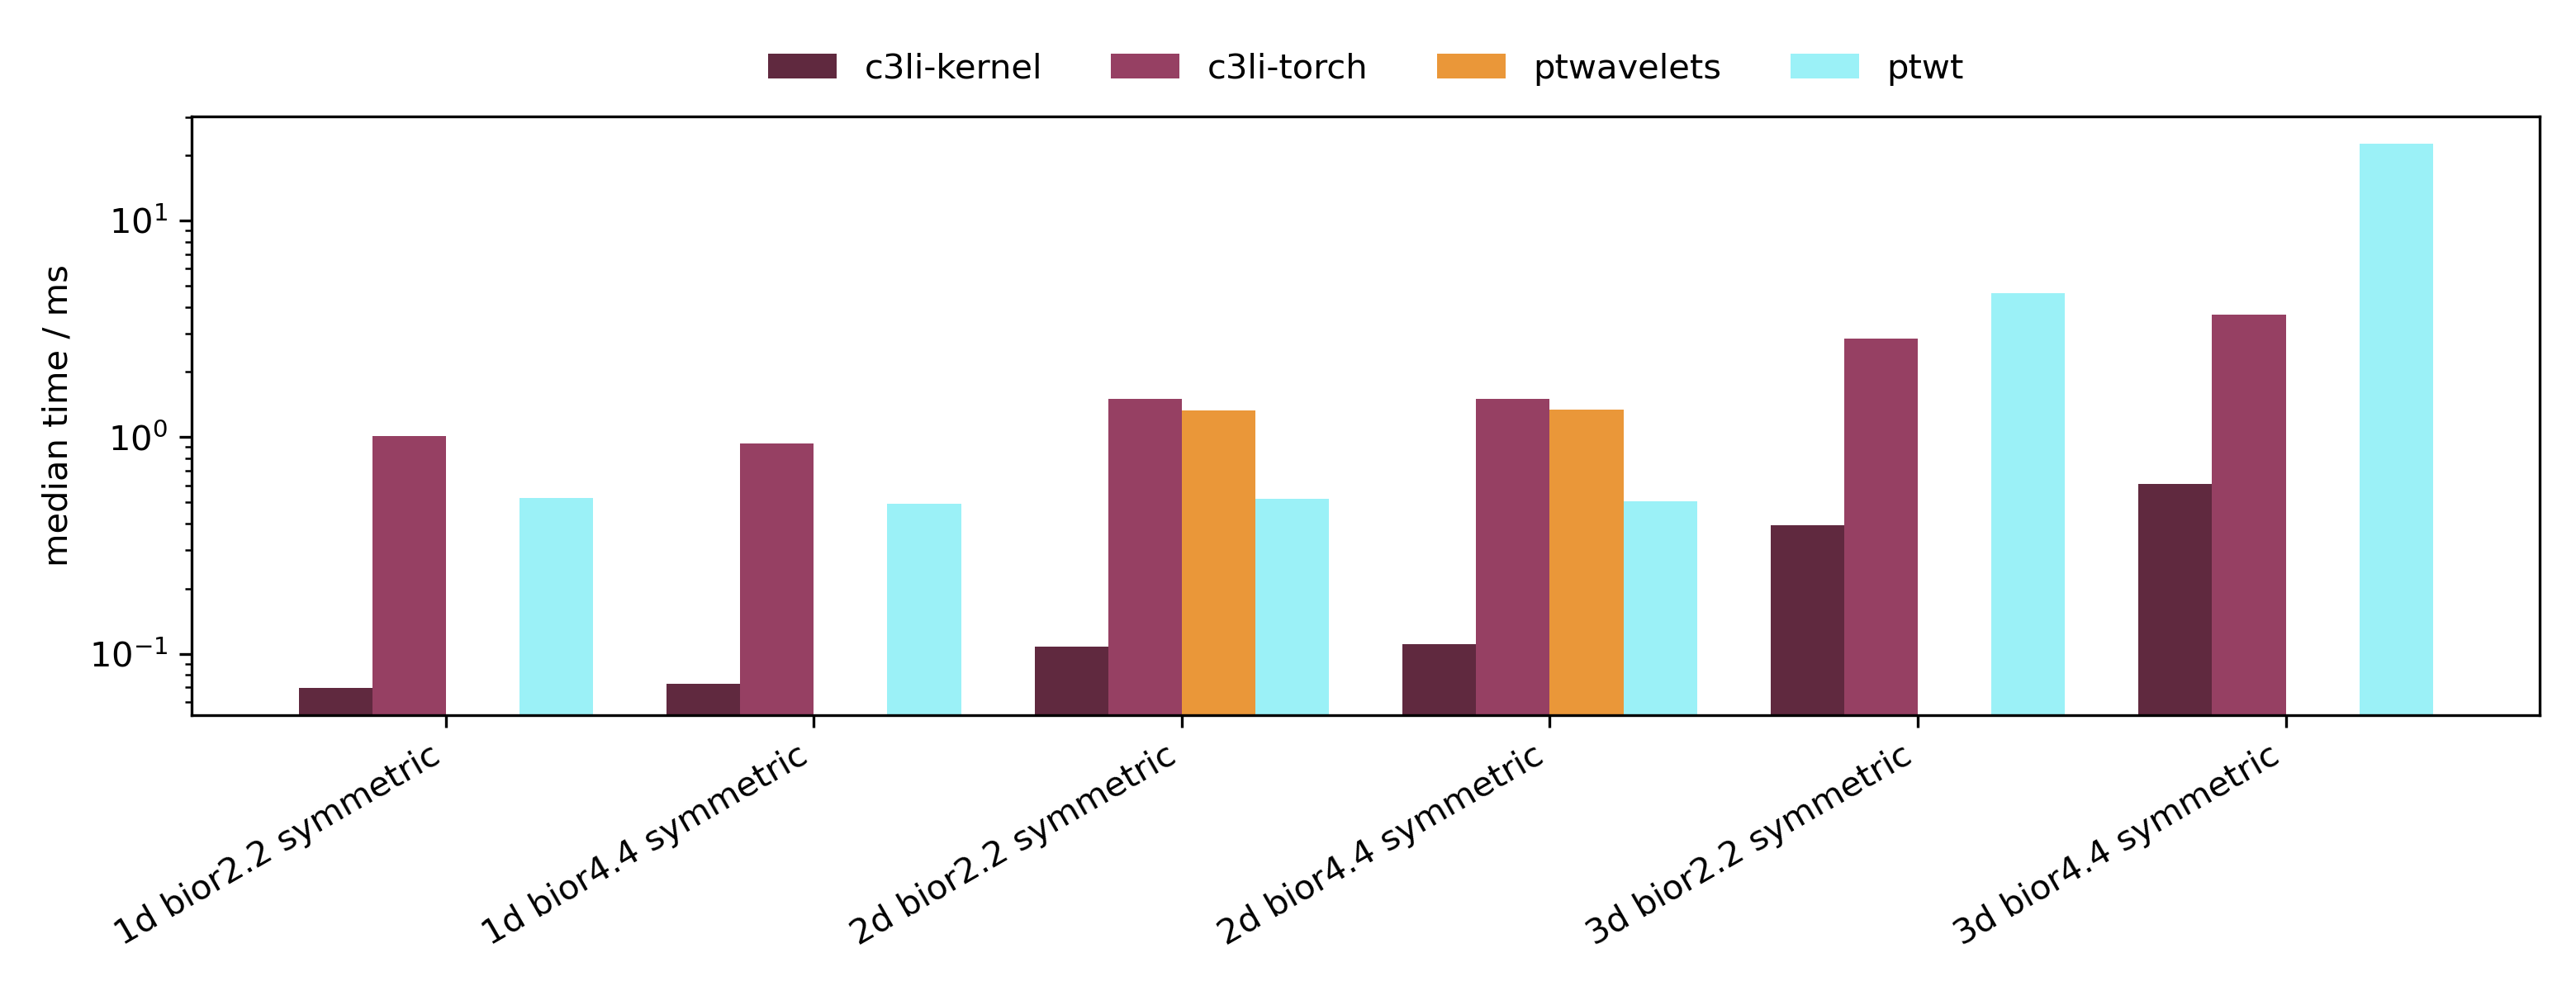
LiteVAE uses the Haar transform, three levels, recursed on the approximation band. JPEG 2000 uses the LeGall 5/3 and CDF 9/7 biorthogonal pair under symmetric extension. The sizes follow from how deep each can go: 9/7 caps at two levels on a 64-long axis, so the volumetric case is 96 cubed.
Reporting
--from-json loads saved results and reports or plots them without
re-measuring anything. Several files are merged, so a sweep split one backend
per process is drawn as one figure:
python benches/dwt_impl.py \
  --from-json \
      docs/assets/litevae-cpu-amd-gfx1151.json \
      docs/assets/jpeg2000-cpu-amd-gfx1151.json \
  --plot dwt-cpu-amd-gfx1151.png
Printing gives the same tables a live run does, one per device and thread count, since every row carries the label and thread count it was measured under. A plot has no such axis, so draw one device at a time.
Results
Forward transform, float32, three levels, batch 2x1, median of five runs
in fresh processes. The CPU runs are pinned to one thread, which is the honest
comparison against PyWavelets; the GPU runs are on an AMD gfx1151 under ROCm
7.2 (PyWavelets is missing because it cannot run on GPUs).
Profiling
--profile attributes the time to operators, so the compiled kernels appear by
name next to the ATen internals. --trace DIR additionally writes a Chrome
trace per case, providing a richer profiling interface.
python benches/dwt_impl.py \
  --device cuda --backends c3li-kernel \
  --dims 2 --sizes 1024x1024 --wavelets haar --modes zero --levels 3 \
  --profile --trace traces/
Open the result at ui.perfetto.dev, or look at
this one, from the command above. It shows the LiteVAE path: one
c3li::haar_wavedec per call wrapping three c3li::haar_nd launches, one per
level, since the fused Haar kernel does both axes at once. Search for
haar_nd to inspect them.
The traces carry profiling overhead (on ROCm roughly twice the measured time), so read them for structure and the tables/plots above for timings.
Dataset reading
Two benchmarks read the very same samples off disk, written once per format
under --data-dir and reused. benches/dataset_types.py times what a first
epoch costs, dropping the files from the page cache before every run so the
reads go to storage; benches/dataset_caching.py times the epochs after that
(stochastic caching), with a share of the samples held in shared memory. Keep
that directory on real storage: nothing on tmpfs can be dropped from the page
cache, and a sweep there measures reads served from memory.
Measuring
python benches/dataset_types.py \
  --samples 1024 \
  --sizes 1x256x256 \
  --batch-size 32 \
  --workers 0 4 \
  --repeats 3 \
  --json dataset_types_1024x1x256x256_b32.json
python benches/dataset_caching.py \
  --samples 1024 \
  --sizes 1x256x256 \
  --batch-size 8 \
  --fractions 0 0.25 0.5 0.75 1 \
  --json dataset_caching_1024x1x256x256_b8_w0_shu.json
Both sweep the sizes, sample counts, batch sizes, worker counts and orders they are given. The caching sweep reads shuffled in the main process by default, since that is where a partial cache shows: a shuffled loader draws uniformly, so the hit rate is the share cached.
Results
A 256 MiB dataset — 1024 samples of 1x256x256 float32 — read
on the CPU, the first epoch as the median of three runs in fresh processes.
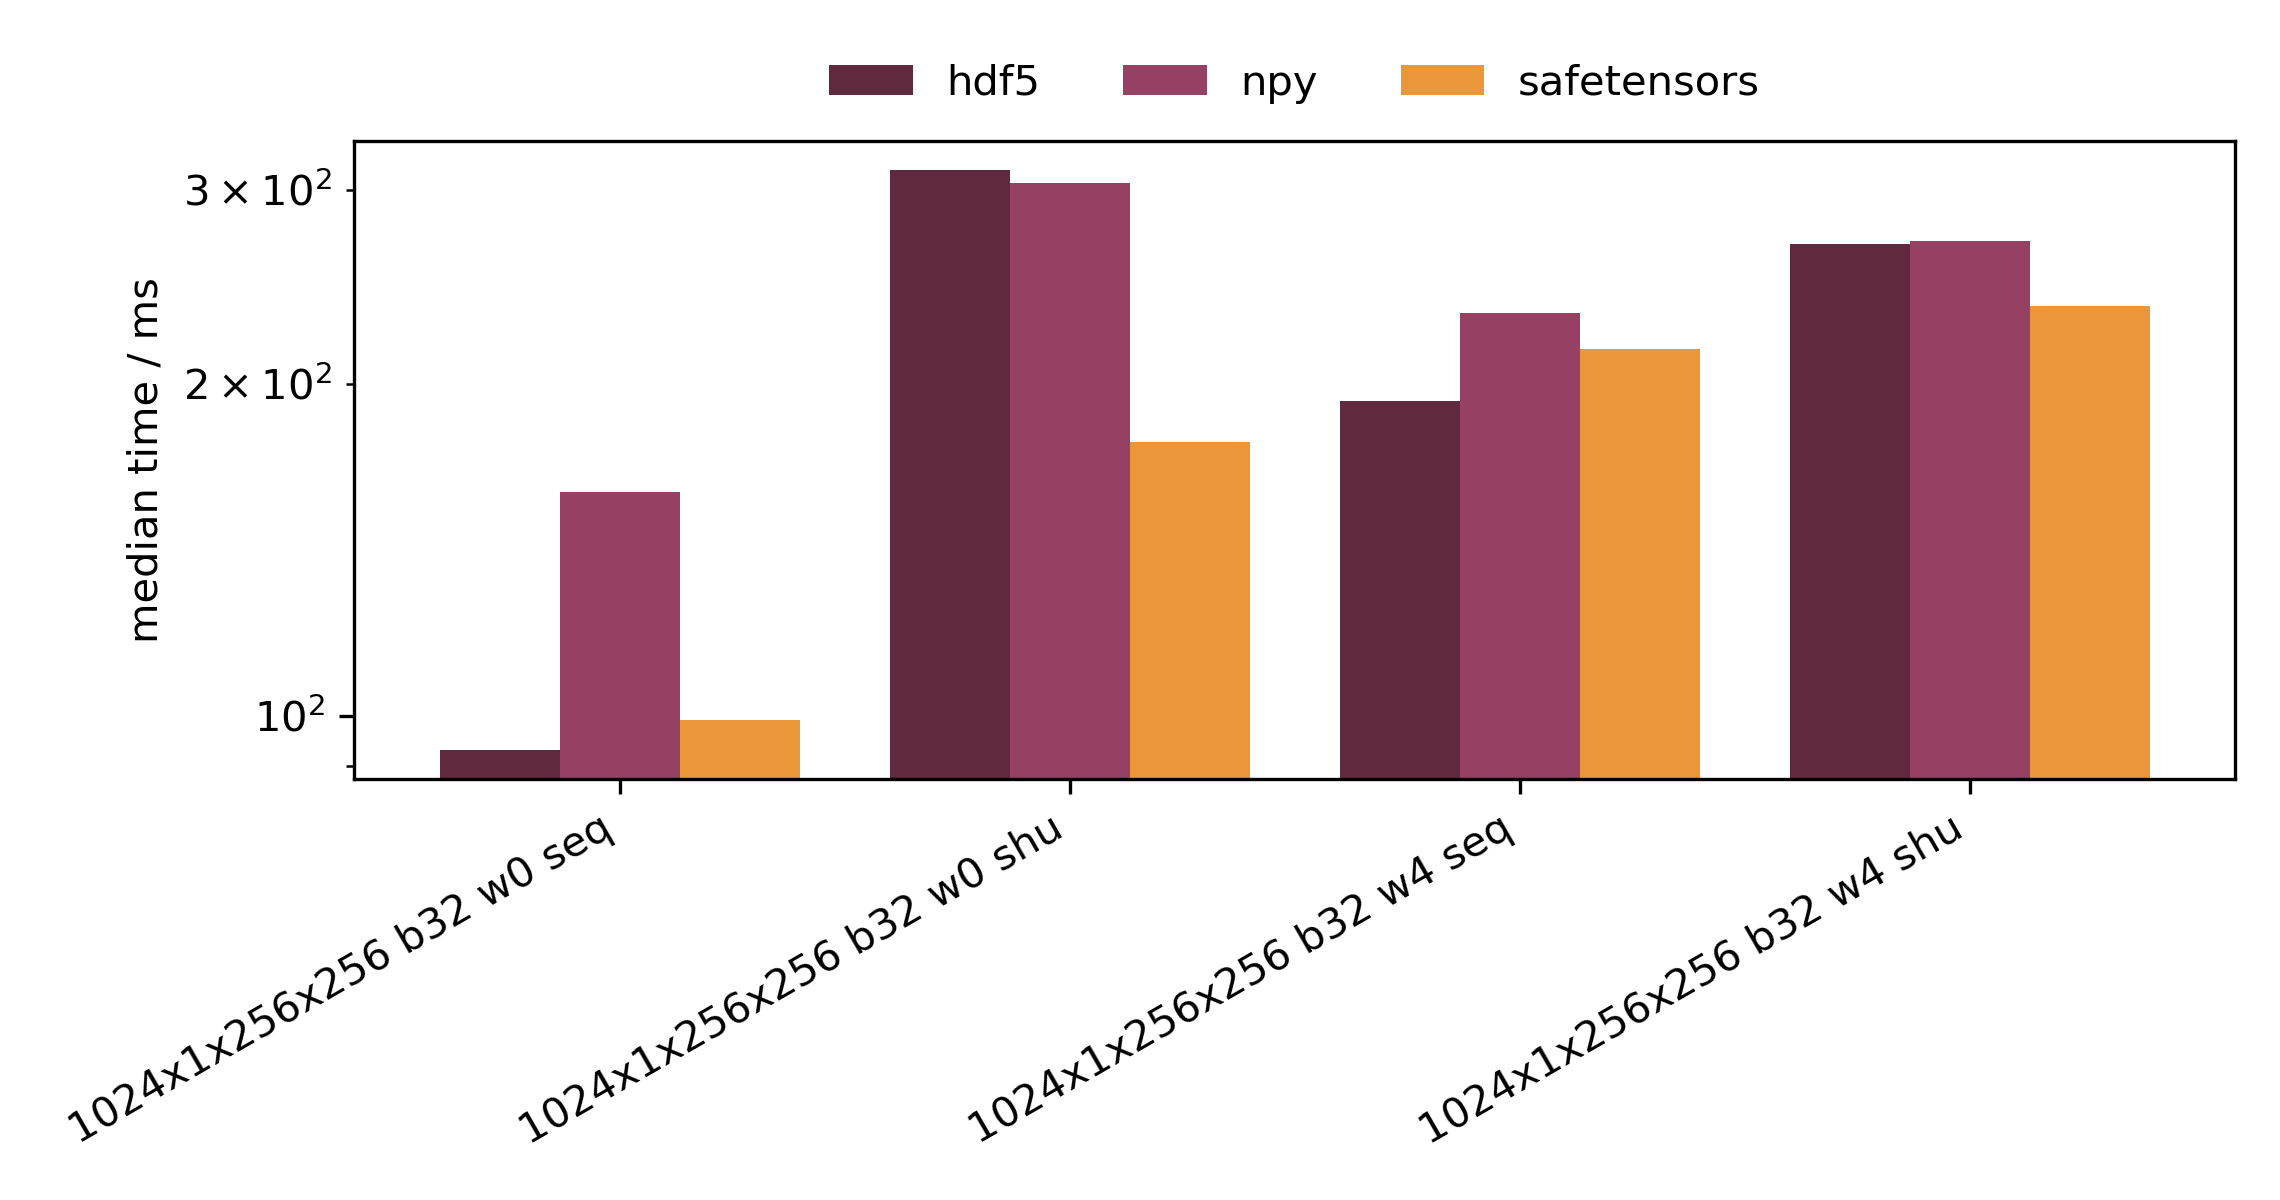
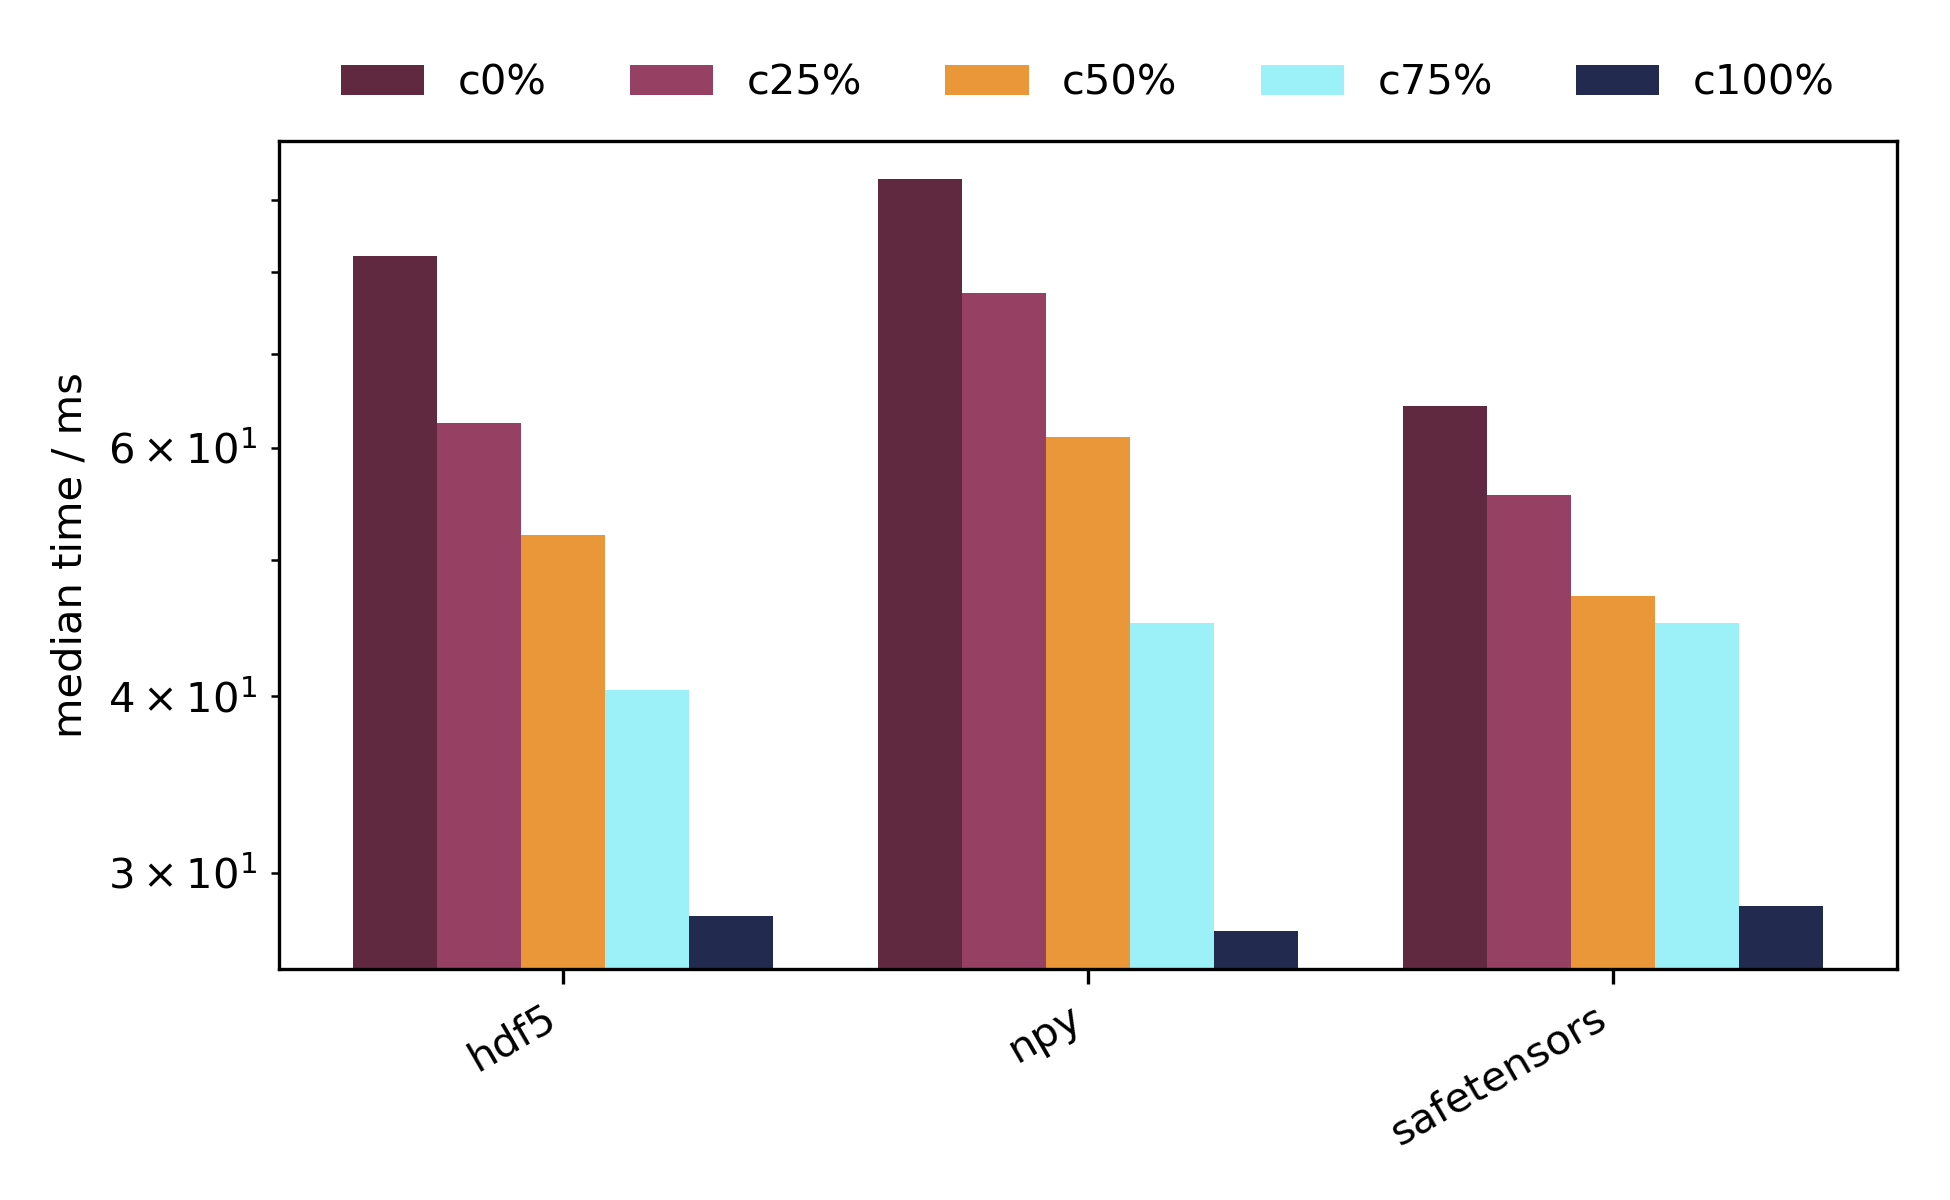
Which format wins depends on the order the loader draws in: HDF5 reads front to
back fastest, at 93 ms against 160 ms for .npy, and safetensors shuffled, at
177 ms against 312 ms. Cached in full they converge on 28 ms, since a cached
epoch is read out of the same shared memory whatever wrote the file.